

S&P 3,000

It has been a brutal couple of months for stocks. The market just experienced its worst first half in more than 50 years. There has been almost nowhere to hide, with all S&P sectors down YTD except for energy. And while the indices have held up relatively well with the S&P 500 now bouncing around -20% YTD, there has been real carnage under the surface. The ARK Innovation ETF (ARKK), the poster child for the excesses of the post-Covid period, peaked in February 2021 and is now down 70% from its peak, with many individual names down 80% to 95%.
This drawdown hasn’t been all that surprising. In his paper Waiting For The Last Dance, Jeremy Grantham warned about a possible bubble peak in early 2021 and laid out how it could play out, based on his experience of the dot com bubble. And he was spot on, with the more speculative areas of the market (unprofitable tech, SPACs, recent IPOs, …) being shot first and the contagion gradually spreading to more established names.
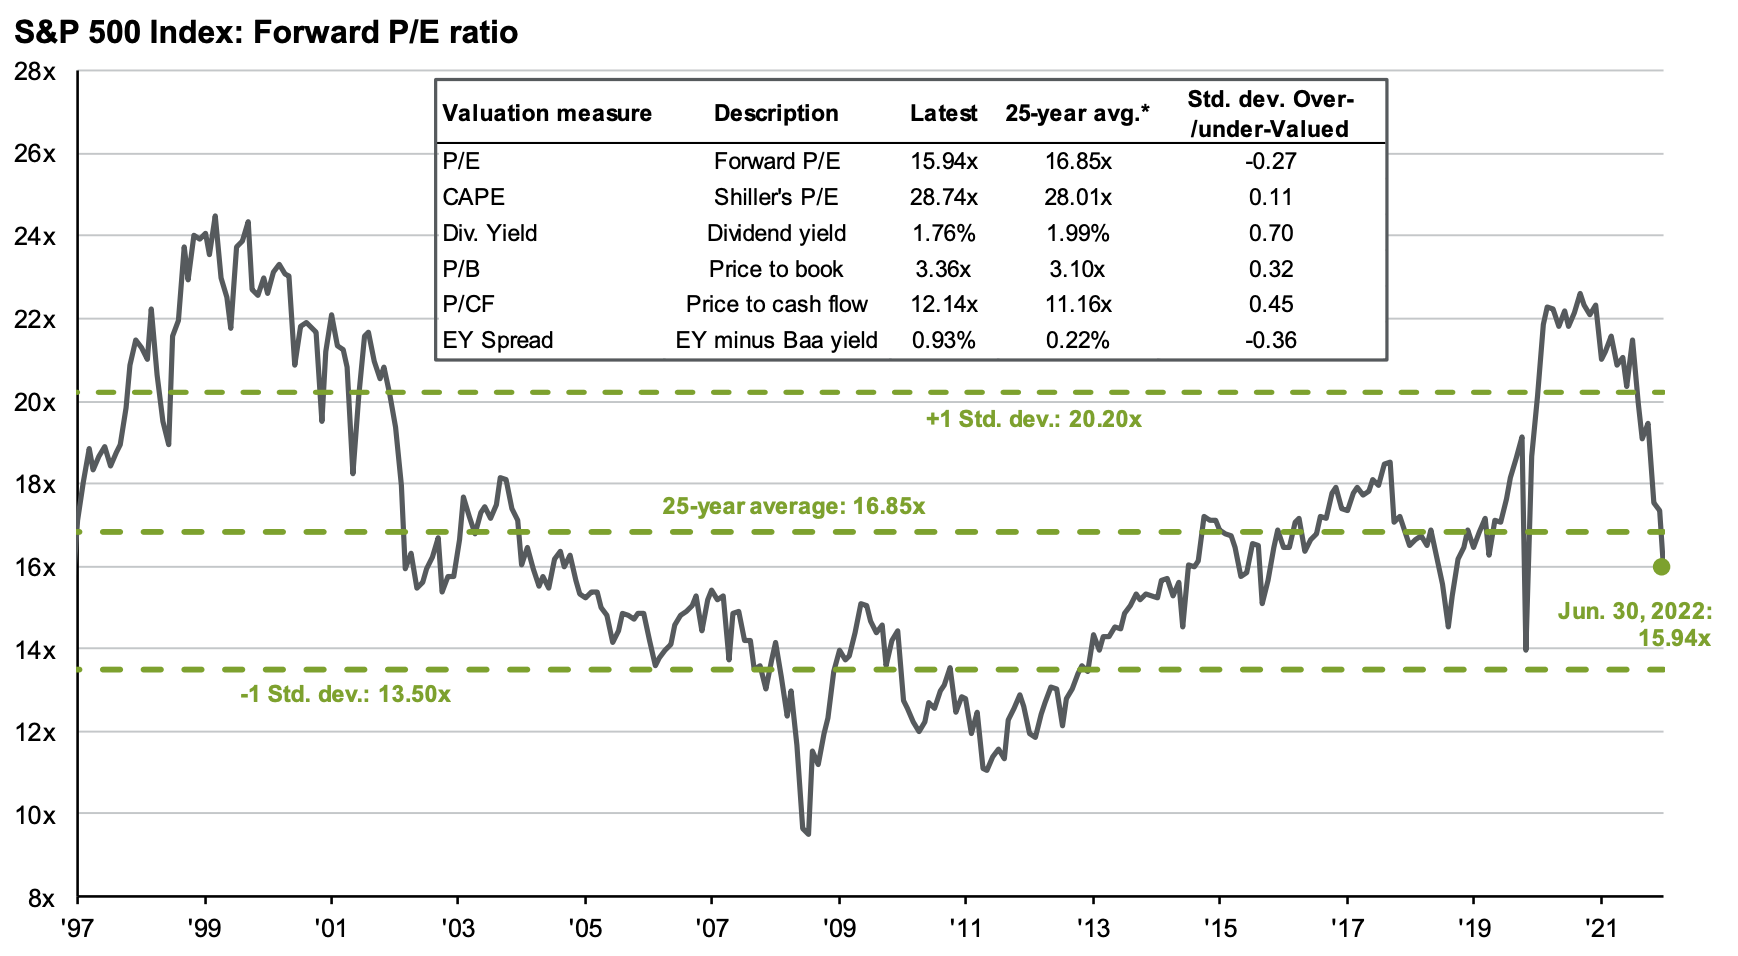
While the “buy the dip” Pavlovian response from investors is still well ingrained, this time might be different. We started the year at peak valuations and peak earnings. In parallel, the Fed has entered a tightening cycle after years of accommodative policies. S&P 500 Forward P/E ratios are finally back to earth, sitting roughly at their 25-year average and broadly in line with the 2015-2019 average. The excesses of the Covid period, with its artificially low interest rates, have mostly been washed out. But have markets bottomed yet?
Entering Phase 2?
Unfortunately, I believe we could be heading lower in the next couple of months. For starters, while valuations have come down, they are far from bargain territory despite the intensity of the sell-off. In addition, we may now just be entering phase 2 of this bear market.
In a recent slide deck, investment firm Coatue has analyzed the dot com bubble and offered their view of the anatomy of a bear market. During the early 2000s, the Nasdaq sell-off was initially driven by a P/E reset similar to the one we have just experienced. After this initial stage that lasted nine month, earnings revision continued to put pressure on equities, and the drawdown ended with a final capitulation.
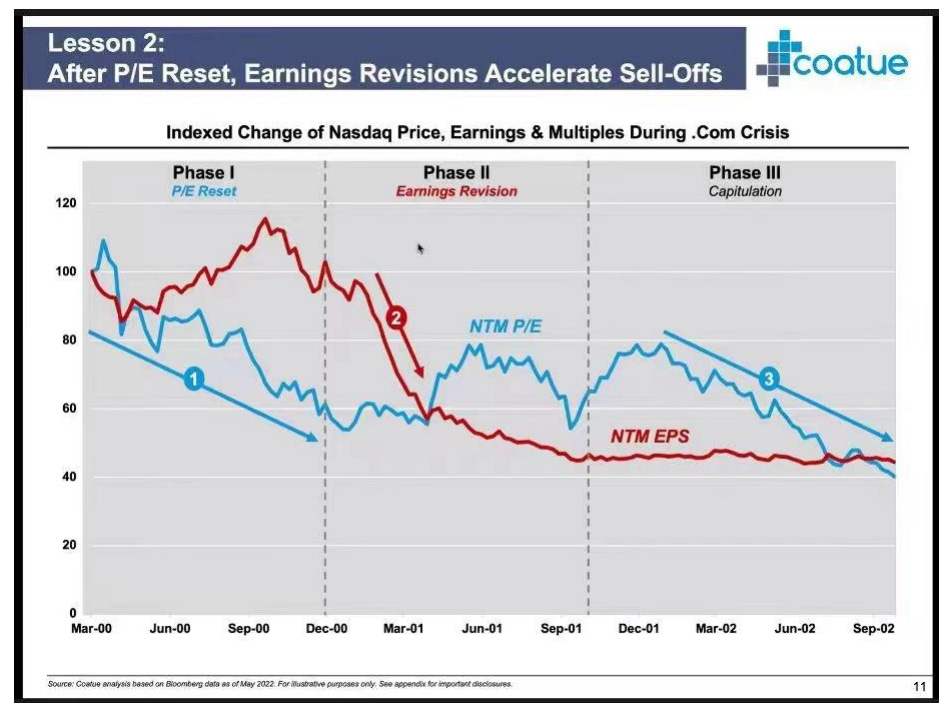
History does not repeat itself, but it often rhymes. The indices today are obviously very different from the Nasdaq in early 2000. Nevertheless, with valuations now back to more reasonable levels, Q2 earnings season starting, and high expectations for next year’s earnings, I believe that we could be entering a similar phase of downward earnings revisions over the next quarters.
Analysts are indeed still baking in record-high operating margins, and expecting earnings to grow to $250 in 2023 for the S&P 50 (although that number has slightly come down in the past few weeks). While 2023 earnings growth rate expectations look realistic in isolation, it is clear that 2021 and current 2022 estimates are exceptionally high and constitute a high hurdle, as they reflect record consumer spending driven by stimulus money and government assistance.
Nominal spending could obviously stay elevated - while savings rate have come down, households still have significant excess savings from the pandemic. Household leverage is low relative to history. And the labor market is still very tight, with job openings largely above the number of unemployed persons. However, I have a hard time believing that with the rotation from goods to services, the lapping of record profits largely stemming from stimulus money, and higher input costs pressuring margins, earnings will grow meaningfully from a base that is way above trend:

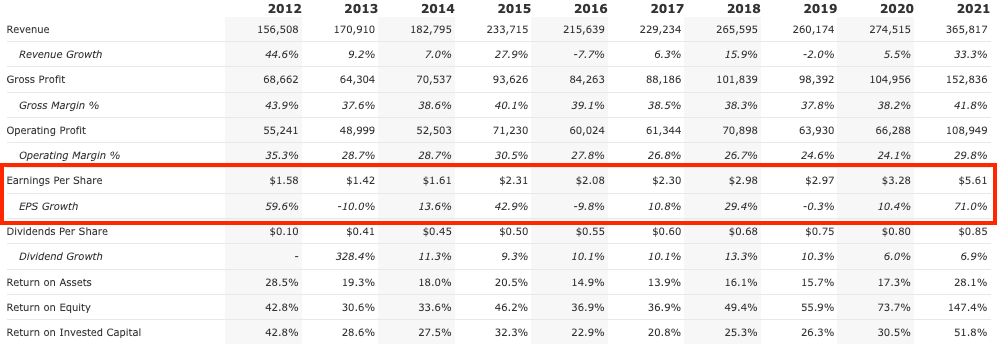
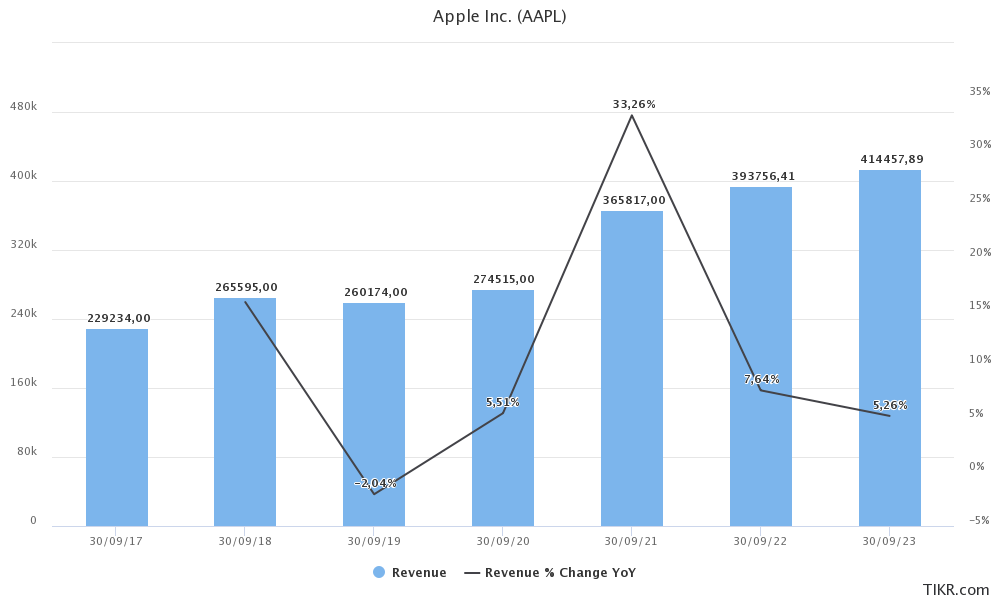
Just think of Apple. No doubt it’s a great company and I would not bet against it, but as the largest S&P 500 constituent it provides a great illustration to the downside risk to earnings. Apple’s EPS almost doubled in 2021 compared to its pre-Covid level (from ~$3 to $5.61), largely driven by explosive revenue growth at a level not seen in almost ten years:
With only 21% of the 2019-2021 revenue growth being driven by services, one has to pause and wonder whether some of that incredible revenue growth could be due to the same pull-forward dynamics that other Covid beneficiaries have experienced, rather than a “new normal” for iPhone demand?
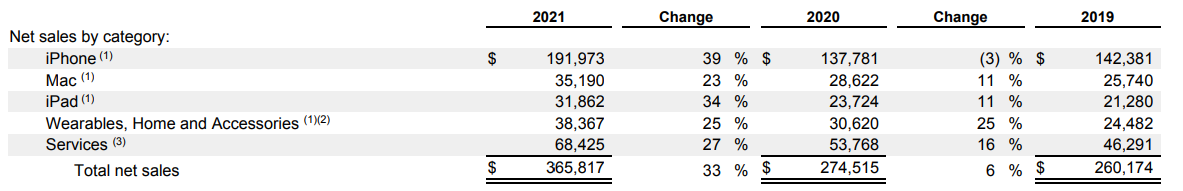
And yet, current FY23 estimates call for more than 5% revenue growth over what could be an inflated revenue base, driving 6% EPS growth expectations.
Maybe Apple and other index heavyweights will hit these high earnings expectations. Maybe it will turn out they have benefited from the pandemic, just like sporting goods and RVs retailers. We will find out soon. In my opinion, risks are highly skewed to the downside.
S&P 3,000?
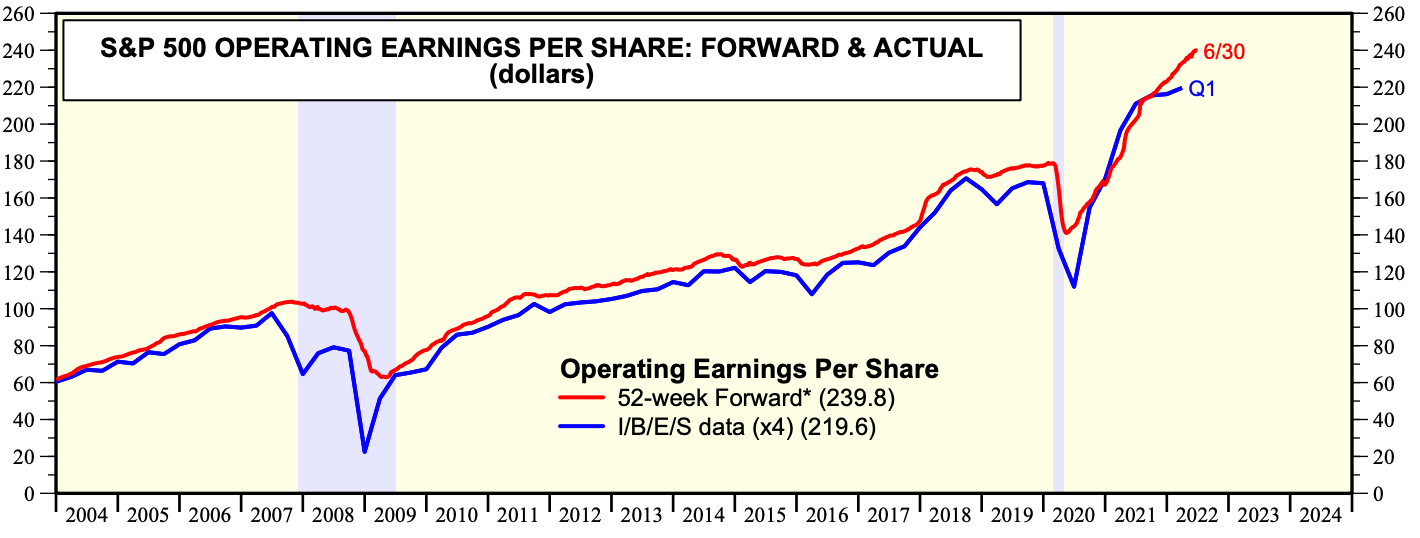
So what could 2023 S&P 500 earnings realistically be? One can do extensive work and use fancy models. I prefer to keep it simple and just eyeball it from pre-Covid trend; as I have yet to hear a good argument as to why going through Covid has given companies structurally higher margins (note the 2018 bump in the chart below is due to the Trump corporate tax cut).
This advanced methodology, with a slight positive adjustment to account for inflation, gives me ~$200 of earnings in 2023 - which incidentally would be approximately 10% below current 2022 estimates, i.e. the impact of a mild recession. Q.E.D.
Picking the right multiple is a(nother) fool’s errand, particularly given the current inflation regime and interest rates uncertainty. But based on history and a simple Gordon Growth Model, 15x to 17x would make sense, leading to a 3,000-3,400 range for the S&P.
With high inflation, we are obviously navigating very uncertain times. I have provided my best guess, but a lot can happen. Inflation could turn out to be transitory, the Fed could pivot in a couple of months, and equities could go to the moon. Alternatively, inflation could remain sticky and further damage consumer sentiment, pressure margins, and lead to a deeper recession.
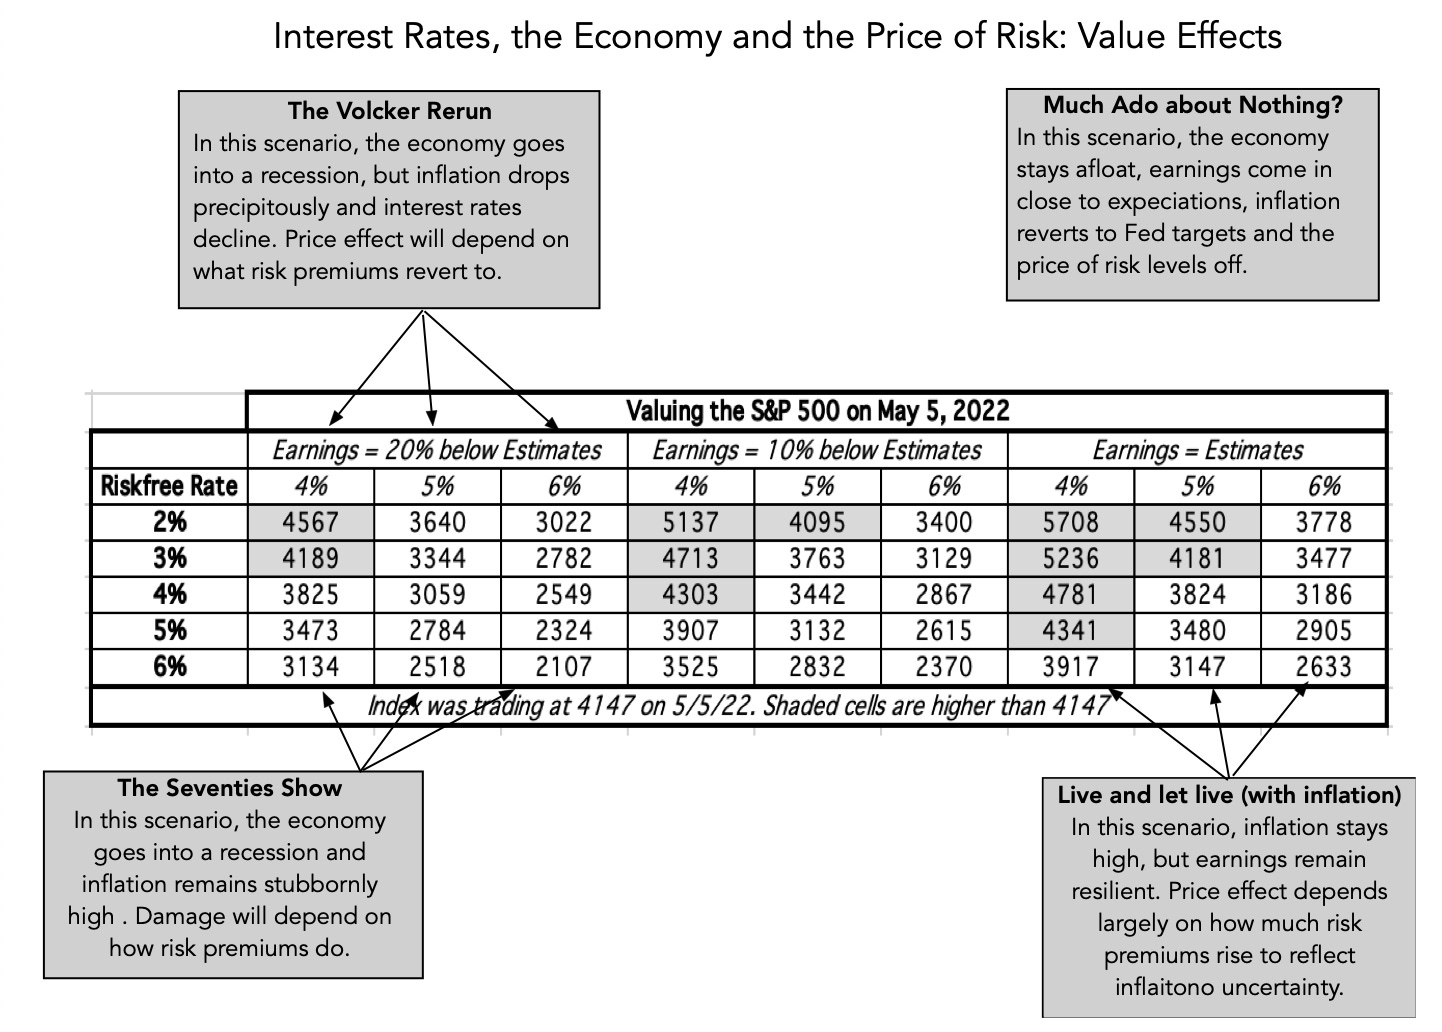
Damodaran has published on his blog a very useful sensitivity table to value the S&P 500 under various scenarios. My earnings methodology corresponds to a ~20% cut to 2023 estimates and a 17x multiple corresponds to a 3% risk-free rate and 5% risk premium (assuming long-term growth at 2%, in line with GDP), as per the Gordon Growth Model (PE = 1/(r-g) or PE = 1/((3%+5%)-2%) = 16.67). Using his table, I hence would get a 3,344 target, close enough to the high bound of my estimate. With the year progressing and giving us additional data points on earnings, rates, and inflation, I find it useful to refer to this table and try to work out what scenario appears to be the most realistic in light of the latest facts.
And while my base case is for indices to go lower over the next 6 to 9 months, I will conclude by stressing that there are a lot of opportunities out there. Some areas of the markets look simply too cheap. There has rarely been so many event-driven opportunities. But in this uncertain period, I would be cautious of using forward multiples to call a bottom. And, cash is certainly not trash.
I wrote up some similar thoughts on AAPL here: https://catapult.substack.com/p/short-aapl?r=5izri&utm_medium=ios
The timing of the revenue/earnings acceleration is very suspicious.